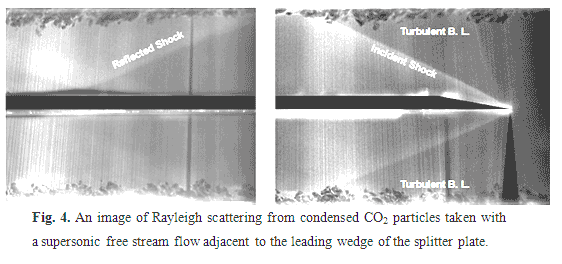
| The flow features in the test section are visualized by two-dimensional Rayleigh laser scattering signals from condensed CO2. The generated fog predominantly occupies the core flow, since the condensed particles will sublimate in the hotter boundary layers. Some particles survive the large-scale mixing in the turbulent boundary layers, revealing boundaries between turbulent eddies and the relative size of the larger turbulent scales. Figure 4 is a composite Rayleigh scattering depiction of the basic features of the supersonic flow generated in the wind tunnel near the splitter plate tip and further downstream. The oblique waves originating from the leading edge of the wedged splitter plate tip in both the upper and lower half of the test section are clearly discernable. The upper wave reflects from the top wall and is visible in both images. That in the lower half arises due to imperfections in the tip and/or slight misalignment of the splitter plate surface relative to the direction of the main flow and is presumed to be weaker than the upper wave, and thus shows no significant reflection in the lower wall. The vertical triangular-shaped region near the tip at the entrance to the lower half of the tunnel is an artifact due to shadowing of the laser sheet from the opaque region near the sharp tip. The most interesting feature resolved in this image is the turbulent boundary layer appearing on both the upper and the lower surfaces of the tunnel, while no detectable (presumed laminar) boundary layers are resolved on the surfaces of the splitter plate. The thickness of the tunnel wall boundary layers in this axial location fluctuate between 2 – 3 mm, representing 10 – 15 % of the tunnel height. The boundary layers on the upper and lower walls immediately behind the incident shockwaves appear to be thinner (1 – 2 mm), as expected, due to the post-shock compression of the flow, and will be more apparent in Fig. 5. |
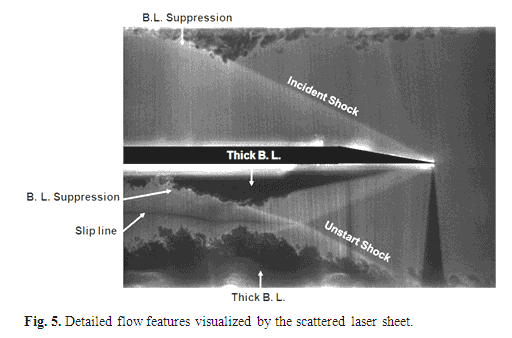
| Figure 5 is a Rayleigh scattered image of the region of the splitter tip, 16 ms following the jet injection in the downstream region (75 mm from the splitter plate tip), and now reveals a much more complex flow, including the development of boundary layers, additional shockwaves, and a slip line. Among the various flow features seen here, two important flow characteristics are depicted in this image, namely the arrival of an unstart shock and the shock-boundary layer interactions on all but the top surface of the splitter plate. At this time in the evolution of the flow, the unstart shock is located in front of a thick turbulent boundary layer on the bottom wall; the cause of the boundary layer growth (e.g. flow separation) is not evident here due to the limitations of the flow visualization technique in the boundary layer region. This shock is initially induced by the jet injection and then propagates upstream (as will be shown in more detail below in Fig. 6). The core flow behind the unstart shock has different properties than that behind the now strengthened tip-generated shock, leading to the generation of a slip-line that persists several channel heights downstream of the merging of the two shocks. Perhaps more pronounced than in Fig. 4, the strong shockwave-boundary layer interaction in the top half of the tunnel reveals strong boundary layer suppression. Similar shock-boundary layer interactions are also observed on the boundary layers that have evolved on both the splitter plate and wall surfaces in the lower half. The unstart shock (refracted across the slip line) contacts the lower splitter plate surface suppressing the now thick (and initially laminar) boundary layer induced by the jet injection. |