[an error occurred while processing this directive] Inlet unstart induced by a jet injection
Home >> Research >> Experimental Support >> Inlet unstart
Inlet unstart induced by a jet injection
 
Planar Laser Rayleigh Scattering from condensed CO2 particles is used to visualize flow structures in a Mach 5 wind tunnel undergoing unstart. Detailed flow features such as laminar/turbulent boundary layers and shockwaves are readily visualized by the technique. A downstream transverse air jet, inducing flow choking, is injected into the free stream flow of the tunnel, resulting in tunnel unstart. A series of time resolved images reveals that an unstart shock originating from the jet injection nozzle first propagates upstream. The tunnel then unstarts upon the arrival of the unstart shock at the inlet. The images, which clearly depict shock/boundary layer interactions, suggest that the unstart shock is caused by the turbulent boundary layer growth/separation initiated by the jet injection, and incident/reflected shockwaves significantly reduce the boundary layer thickness.
 
 
Introduction
Several studies have addressed the mechanism associated with scramjet engine unstart which can cause in-flight engine malfunctioning (Wieting 1976; Hawkins and Marquart 1995; Rodi et al. 1996; Shimura et al. 1998; O’Byrne et al. 2000; Wagner et al. 2008, 2009). Unstart is believed to be caused by the thermal choking (Mashio et al. 2001) of the supersonic flow triggered by increased heat release in the combustor as a result of an increase in fuel injection, leading to an abrupt loss of thrust (Heiser and Pratt 1993; Sato et al. 1997; Kodera et al. 2003). Simulations (McDaniel and Edwards 2001) indicate that the pressure rise resulting from the heat release (thermal choking) is followed by boundary layer separation cascading into large-scale disturbances and blockage of the upstream flow. To delay this unstart transition, researchers have proposed the use of isolators (Curran et al. 1996; Sato et al. 1997; Wang and Le 2000; Tam et al. 2008) and boundary-layer bleeding (Kodera et al. 2003). The unstart dynamics also results in the spawning of an unstart shock system induced by this boundary layer separation that propagates upstream. The propagation speed of this unstart shock was estimated to be in the range of 10 – 27 m/s (Wieting 1976) and in some cases as high as 55 – 70 m/s (Rodi et al. 1996), as determined by wall pressure measurements.
 
There are relatively few experimental studies of this combustor-driven unstart dynamics due to the difficulties in providing realistic flight conditions (high enthalpy supersonic flows) in ground test facilities. Some insight into the unstart process can be obtained in facilities that at least partially reproduce flight conditions (comparable Mach number and pressure, but lower static temperature). In a very recent study, Wagner et al. (2008, 2009) investigated flow unstart that was caused by the downstream mechanical actuation of a plate, which partially blocked the flow at the exit of the supersonic tunnel. In that study, high speed Schlieren photography and Particle Image Velocimetry (PIV) were used to characterize unstart dynamics. While providing good visualization, Schlieren is a line-of-sight measurement. On the other hand, PIV provides planar information, but is by its very nature, pixilated to provide reasonable velocity statistics. Both diagnostics, while very useful in providing information about general flow features, are unable to resolve fine-scale features in the flow for detailed comparison to numerical simulations.
 
In this study, we visualized in more detail supersonic unstart flow features (e.g., boundary layer structure, shockwave interactions) using Rayleigh scattering from condensed CO2 particles (particulate fog). Miles and Lempert (1997), Wu et al. (2000), and Poggie et al. (2004) have demonstrated the general use of this diagnostic technique for low temperature/pressure supersonic flows expanded through the diverging nozzle of a supersonic wind tunnel of low (ambient) stagnation temperature. The expanding nozzle flow experiences a drop in static temperature, and when seeded with CO2 vapor, produces condensed (solid) CO2 particles. These CO2 particles subsequently evaporate under varying environments provided by primary flow features such as shockwaves and boundary layers where the local static temperature increases. Laser light scattered from the particles, typically several nm to tens of nanometers in size, highlight these features with enough contrast allowing a high fidelity visualization of the flow. However, this visualization technique is constrained to flow conditions that are distributed across the CO2 sublimation curve, usually over a fairly low temperature regime (< 150K) at less than atmospheric pressure. For the present study, an in-draft Ma = 5 supersonic wind tunnel (see below) at modest static pressures (1 kPa) and ambient static temperature (50 K) accesses this regime for flow visualization. As described below, the unstart of the supersonic flow induced by the injection of a downstream air jet generates features that are easily discerned by Rayleigh scattering from this CO2 fog.
 
 
Experimental Setup

The experimental facility consists of a Ma = 5 in-draft wind tunnel, an integrated laser system and a jet injection module.

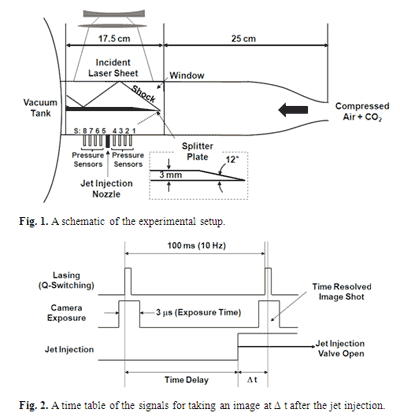
A schematic of the Ma = 5 wind tunnel is shown in Fig. 1. Air at high pressure (P0 = 350 kPa and T0 = 300 K) containing CO2 (approximately 25% by volume) expands through a converging/diverging nozzle (25:1 area ratio) to establish a relatively uniform Ma = 5 flow in a rectangular test section (4 cm × 4 cm cross-sectional area). The exit of the tunnel is connected to a vacuum tank that accommodates the incoming mass flow for approximately 5 seconds of run time. During this run time, the vacuum tank pressure is maintained at values lower than the static pressure in the test section. A honeycomb of 2.5 cm in length and 3 mm hexagonal cells is placed upstream of the converging nozzle to suppress flow swirling, mostly generated at various junctions in the gas stream inlet piping. The static pressure and temperature of the flow in the test section is approximately 1 kPa and 50 K, respectively.

A detailed characterization of the variation in Mach number of the flow across the test section is carried out by measuring the shock angle from a sharp leading wedge of 12° angle using Schlieren photography. The measured Mach number midway across the tunnel is approximately Ma = 4.9, with a 5 % variation wall to wall (boundary layers were not resolved). Windows on both sides of the test section and transparent upper/lower walls allow optical access. A 3 mm thick splitter plate(aluminum plate), having a sharp leading wedge and a transparent slotof an embedded acrylic plate divides the test section into two parts of equal cross sectional area. The sharp leading wedge of an asymmetric design (12° angled wedge in the top half of channel), as shown in Fig. 1, is used to generate a relatively shock-free flow in the lower half while it causes a shock train in the upper half. Static pressure traces on the bottom wall of the tunnel are recorded using eight fast response (100 kHz) pressure sensors (S1 – S8: PCB Piezotronics, Model 113A26). The sensors and the jet injection nozzle, placed between S4 and S5, are separated by 15 mm along the centerline of the bottom wall parallel to the free stream flow direction: S1 and S8 are located 60 mm upstream and downstream from the nozzle, respectively. The distance between the tip of the splitter plate (270 mm downstream from the converging/diverging nozzle throat) and the nozzle is 75 mm.

The experimental components for Rayleigh scattering include a Nd:YAG laser (New Wave, Gemini PIV) capable of generating approximately 100 mJ/pulse (532 nm wavelength) energy with 10 Hz pulse repetition, an unintensified CCD camera (La Vision, Imager Intense) and a computer (not shown) to facilitate data acquisition. The laser beam is transformed into a thin sheet of 0.5 mm thickness to illuminate the test section using a combination of two concave cylindrical lenses and a convex spherical lens. Scattered light is captured by the camera along a direction normal to the laser sheet. Laser firing is synchronized with the CCD camera exposure (3 microns shutter), as illustrated in Fig. 2. One of the laser pulses is selected to trigger the jet injection module while the tunnel is operating, but delayed as desired by a pulse delay generator (SRS, DG 535) to take time resolved images at different phases (Dt following the injection of the jet) in the flow evolution induced by the jet injection. The jet injection is controlled by a solenoid valve (ASCO, Red Hat II) driven by a controller (Optimal Engineering System Inc.) receiving the trigger signal from the delay generator. A sonic jet (air, in these studies presented here) is injected into the test section through a 3 mm diameter hole in the bottom wall resulting in a flow disturbance and an overall increase in flow pressure and temperature. Relevant to the jet interaction and mixing with the supersonic free stream is the square root ratio of the jet momentum flux to that of the free stream (R). For our results described here, R is approximately 4.5.


Results
  1. Unstart
  2. Flow Visualization
  3. Unstart Time Behaviour
 
 
Conclusions
An inlet duct unstart condition was generated in a Ma = 5 wind tunnel induced by downstream air injection. The sonic transverse air jet, injected into the free stream flow is seen to cause a sudden rise in pressure and temperature downstream of the injection location. Surface pressures recorded on the bottom wall of the tunnel upstream and downstream of the injected jet indicate that the surface pressure initially rises at the furthest downstream sensor (S8), located 60 mm from the jet nozzle. This pressure disturbance propagates upstream to sensor S1, at 60 mm upstream from the jet nozzle over a time of 5.5 ms, corresponding to a speed of 22 m/s.
 
The detailed tunnel unstart process was studied by visualizing the supersonic flow using Rayleigh scattering of a thin laser sheet from condensed CO2 particles in the free stream flow. This diagnostic technique is capable of highlighting detailed flow features such as shockwaves, boundary layers and slip lines. Turbulent boundary layers of 2 – 3 mm thickness on upper and lower wall surfaces of the tunnel were seen before the jet injection. A thicker turbulent boundary layer evolved in front of the jet nozzle following jet injection, spawning an unstart shock which interacted with the initially laminar boundary layer on the splitter plate wall. This boundary layer propagated upstream until it reached the leading tip of the splitter plate leading to a stronger shock emanating from the splitter plate tip. The interaction of this shockwave with the unstart shock, the continued forward propagation of the unstart shock and the associated subsonic high pressure disturbance behind the turbulent boundary layer, which evolved on the bottom wall, eventually leads to a complete unstart of the flow.
 
 
[an error occurred while processing this directive]