Outline
- Introduction of jets in crossflows
- Expansion tube
- Experimental techniques
- Inflow and boundary conditions
- Injection calibration and characterization
- Results
Transverse jet in supersonic crossflow
A jet in crossflow (JICF) is a fundamental canonical flow for the investigation of turbulent mixing and combustion. It is of relative simplicity yet retaining many features of interest, such as three-dimensionality, separation and recirculation regions, wall-bounded effects, and vortical flows. Furthermore, it maintains some level of practical relevance of engineering applications being found in many technological processes. A wide body of work has been conducted to characterize and study this system, both at low- and high- (supersonic) speeds, especially under nonreacting conditions. Reacting transverse jets in the supersonic regime have, however, received much less attention, partially due to the requirements and complexity to sustain combustion in a supersonic flow (Lee et al., 1992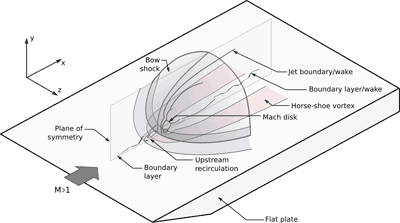 ; McMillin et al., 1994; Ben-Yakar et al., 1998; Heltsley et al., 2007).
In addition to the traditional vortical structures generated by the interaction of the jet with the crossflow that are present in low-speed JICF, such as horse-shoe vortices at the base of the jet, jet shear layer vortices, the counter-rotating vortex pair in the far-field of the jet, and wake vortices that stretch from the bounding wall to the jet (Frick and Roshko, 1994), the supersonic counterpart has many more features. As shown in Fig. 1, some of these structures are the three-dimensional bow shock generated by the blockage effect of the issuing jet and that wraps around the base of the jet, the upstream recirculation region caused by the bow-shock-induced boundary layer separation, and a recirculation region just downstream of the injection porthole. Furthermore, the incoming boundary layer experiences an interaction with the bow shock that can extend further away form the immediate vicinity of the injector.
Global characteristics of JICF's, such as penetration, have been found to primarily depend on a single parameter (See for example Margason 1993 for low speed JICF), the jet-to-crossflow momentum flux ratio J defined as
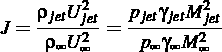
This parameter also describes the global features of the supersonic counterpart (see, for example, Portz and Segal, 2006, regarding jet penetration).
The objective of this work is twofold:
- Investigate mixing, ignition, combustion, flame holding and stabilization processes in the supersonic regime at the unit problem/device-sub-system level
- Improve the physical understanding of and quantify mixing and combustion processes at supersonic speeds
- Provide data for mixing and combustion model validation as a sub-part of the heat release model
With respect to the above objectives, the most recent work aimed at investigating the effect of J on ignition and reaction zone structure of JICF using a series of diagnostics techniques, such as Schlieren, OH* chemiluminescence and OH planar laser-induced fluorescence (PLIF) imaging, and surface pressure measurements. The freestream conditions are maintained constant.
Expansion Tube
The ongoing experiments are conducted at the Stanford 6” Expansion Tube Facility located in the High Temperature Gasdynamics Laboratory. The operation principle and the theoretical analysis of the operation of an expansion tube can be found in Trimpi (1962). A detailed description of our flow facility can be found in Heltsley et al, 2006.
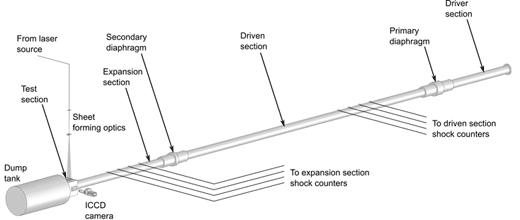
An expansion tube is a short duration, impulse flow facility used to produce high-enthalpy, moderate to high Mach number flow conditions replicating a wide range of aerothermal conditions found in many propulsion and space applications. As shown in the schematic diagram above (Fig. 2), the expansion tube is composed of three circular sections 14 cm in (inner) diameter: a driver, a driven and an expansion (or acceleration) sections, respectively. The expansion section terminates into the test section where the test article is placed and which is open onto a vacuum dump tank. The three sections are separated by diaphragm assemblies and are independently pressurized with the gas of interest.
The test begins when bursting of the primary diaphragm is induced. The test gas (room air), contained in the driven section, is first processed (compressed and heated) by the primary shock generated by the rupture of the primary diaphragm, and it is then reprocessed by the unsteady, constant area expansion occurring when the primary shock ruptures the secondary diaphragm. This latter process accelerate and cools the test gas to the final aerothermodynamic state. The processed test gas then flows at the end of the expansion tube where the test article is placed in the test sections. The final aerothermodynamic state (p, T, M) of the test gas can be adjusted by changing the filling pressure of each of the three sections, allowing for a wide range of conditions to be explored. Furthermore, since the test gas is not exposed to high intermediate temperatures, the chemistry of the incoming flow can be more effectively controlled. The “test time”, defined as the portion of the total flow time over the test model where (quasi-)steady test gas conditions are observed is typically on the order of 0.1-0.5 ms.
Experimental Techniques
The following measurement techniques are used in this work:
- High-speed Schlieren imaging
- OH* chemiluminescence
- OH planar laser-induced fluorescence (PLIF)
- Surface pressure measurements using high-response pressure transducers
Inflow and Boundary Condition
Because a strong motivation for this work is model validation, a significant effort is placed on defining and characterizing the inflow and boundary conditions of the experiments. A brief description of the relevant results are summarized below.
Freestream conditions
As introduced above, taking advantage of the flexibility of the expansion tube, we are capable of investigating a wide range of conditions relevant to scramjet combustion. This flexibility was, for example, exploited in some of our previous work (Heltsley et al., 2007, 2010). In the out most recent work, however, we have selected a single freestream condition representative of the conditions in a scramjet engine of a hypersonic vehicle at Mach 8 flight and 30 km altitude. The nominal conditions, estimated from direct observations on directly measurable quantities such as Mach number and static pressure, are the following: p = 40 (+/- 3) kPa, M = 2.4 (+/- 0.05), and T = 1500 K.
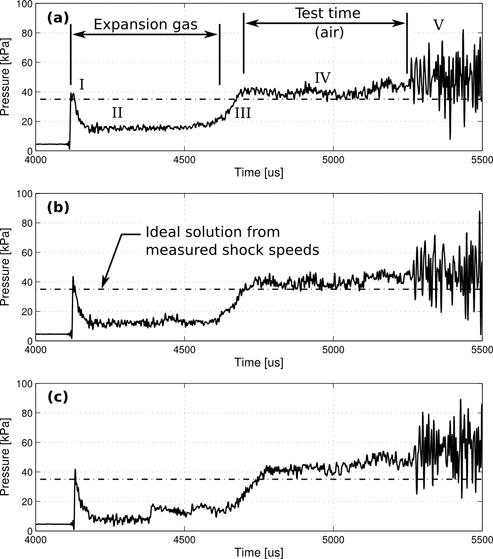
The operation of an expansion tube is intrinsically an unsteady event, since the test times are relatively short (on the order of half a millisecond). It is therefore necessary to understand the evolution of the flow and the effects of the transients on the observations. A time history of the wall pressure variation on the flat plate at three different downstream locations during a representative experiment under the nominal freestream conditions of the JICF work is shown in the figure below (no injection was carried out). Three different measurement points were considered: at the injector location (top graph) and at two location at 19 mm intervals (middle and bottom graph). The wall pressure is measured with a fast pressure transducer embedded in the flat plate. The time axis refers to the initiation of the test and corresponds to the first detection of the primary shock in the driven section. Five relevant events in the evolution of the flow can be identified from these traces. For the particular conditions considered, the expansion gas (Helium) arrives at about 4.1 ms (I) and undergoes an expansion at the exit of the expansion tube into the test section due to a pressure mismatch (II). The contact surface between expansion and test (air) gas arrives at about 4.7 ms (III) and the test gas follows (IV) till an flow disturbance arrives at about 5.25 ms (V) that terminates the test time (defined between III and V). For this particular conditions, the test time is on the order of 0.5 ms.
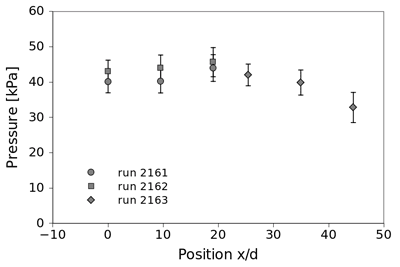
The time-averaged wall pressure as measured during the test time and along the flat plate centerline is shown in the following figure (x/d = 0 refers to the injector location on the flat plate). Multiple repetitions under the same nominal conditions are shown in the plot. The error bar indicated in this figure refers to the time variation (root-mean-square) of the measured pressure during the test time.
Fuel injection - Overview
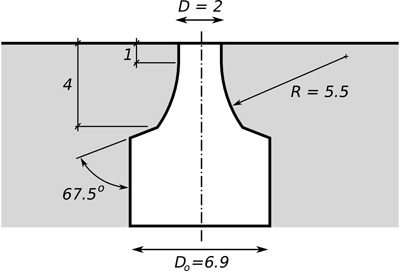
Fuel is injected from a contoured nozzle in the flat plate as shown in the figure below. All the relevant dimensions are reported in mm. Throughout the current work high purity Hydrogen is used as fuel.
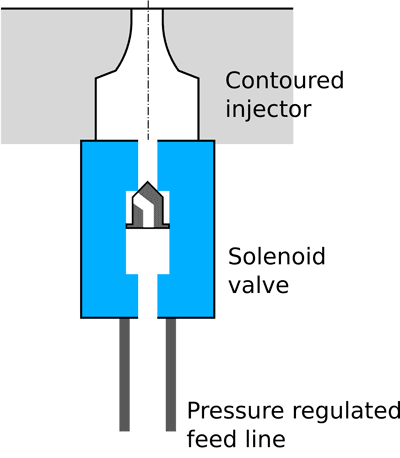
Fuel is delivered from a pressurized gas cylinder at room temperature (nominally 298 K) through high-pressure stainless steel flexible tubing to a fast-response solenoide valve mounted directly at the entrance of the plenum of the injector to minimize latency in the injection system (see figure below). A pressure regulator, placed between the high-pressure fuel cylinder and the delivery solenoid valve, maintains the pressure upstream of the injection valve to a nearly constant preset value.
With reference to the previous figure showing the temporal variation of the wall static pressure during a representative experiment, the nominal injection timing begins at time equal zero and it continue for 10 ms. Details of the injection process are summarized in the following section.
Fuel Injection - Calibration
Two different approaches have been followed to calibrate and characterized the fuel injection system. The primary quantity used to characterize the injection system (knowing the geometry of the contoured injector) is the jet stagnation pressure Po. The jet is modeled as an underexpanded jet. Therefore, knowing the stagnation conditions (Po, To) of the jet and assuming isentropic expansion in the contoured injector, the bulk mass and momentum fluxes can be estimated (which are relevant quantities to define J in JICF experiments or the equivalence ratio in a combustion modeling/heat release context). Furthermore, considering the short test time of the experiments, it is necessary to investigate the temporal characteristics and evolution of the injection process and of the relevant flow features. For this purpose, two different approaches have been used to infer the stagnation pressure of the jet and investigate the formation of the jet under quiescent conditions:
- An indirect approach using known relations between observable quantities of the flow (Mach disk stand-off distance) and the jet stagnation-to-ambient pressure ratio (Po/Pa).
- Directly measure the fuel stagnation pressure and its temporal variation in the plenum of the injector.
Indirect calibration For the indirect calibration we use the know relation between the Mach disk stand-off distance of an underexpanded jet in a quiescent medium and the ratio of the jet stagnation pressure (Po) and ambient pressure (Pa). The relation determined by Ashkenas and Sherman (1962) or by Crist, Sherman and Glass (1968) is used. For example, Crist et al (1968) found that for a wide range of pressure ratios (Po/Pa), fluids, temperature, and injector configuration, the following correlation holds
![]()
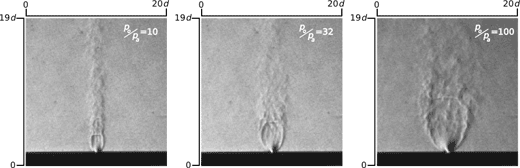
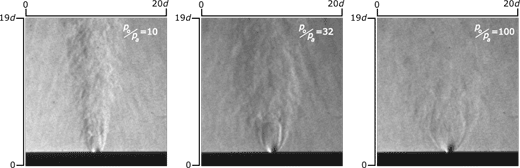
where $y_M$ is the Mach disk stand-off distance and D is the jet diameter. The Mach disk stand-off distance is measured from a set of Schlieren images of the barrel shock forming injecting fluids at different regulator back-pressure (what we can control in the experiments) into a quiescent ambient at different pressure values. Examples of Schlieren images of underexpanded jets are shown in the following figure (the top figure refers to nitrogen injection and the bottom figure refers to hydrogen injection at different Po/Pa values).
Direct calibration
The stagnation pressure of the jet was also inferred from pressure measurements in the injector plenum under different injection conditions (ambient and regulator pressure). A small pressure taps was created in the plenum connected to a fast-response pressure transducer.
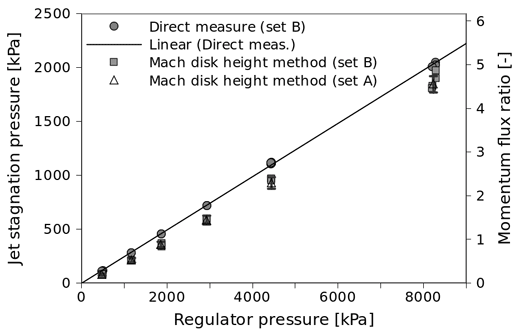
Following the indirect and direct calibration approach, the following calibration curve relating the jet stagnation pressure and the regulator pressure is constructed. Both approaches reveals a direct relation between these two quantities, but there is a consistent discrepancy between the two approaches. The results of the indirect method always suggest a value of Po that is 10-20% lower than what measured in the plenum of the injector. The observed discrepancy cannot be reconciled even if the (known) uncertainty in the indirect approach are considered (error bars). In the study, the results of the direct method are used.
Injection time histories and underexpanded jet formation
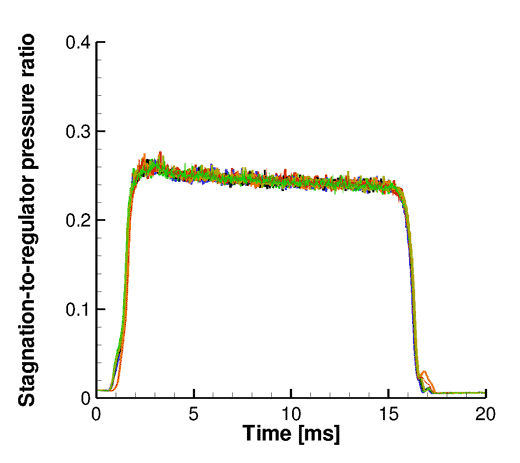
The direct method of calibration also provides information on the time evolution of the jet stagnation pressure that can be used to interpret the results of the experiments. The following figure shows the measured jet stagnation to regulator pressure ratio as a function of time for a representative condition of injection. In this figure eight different repetitions under the same nominal conditions are re ported to show the repeatability of the fuel injection process.
Similar jet stagnation pressure time traces are acquired (multiple times) for the cases relevant for the study. The following figure, for example, shows the temporal variation under different regulator pressures.
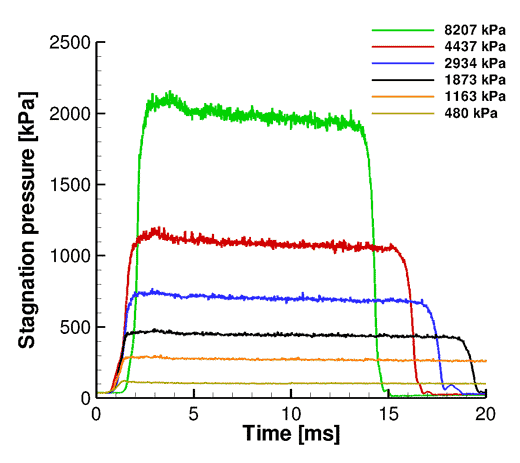
These time history profiles indicate that there is about 1 ms latency in the response of the injection system, followed by about 1 ms transient before a nearly steady pressure value is reached in the plenum. Note, however, that a slight linear decrease in the jet stagnation pressure is observed from these tests (that amounts to about (0.5+/-0.1)%/ms). It is believed that this trend is due to the capacitance effects of the pressure regulator and fuel feed line. Furthermore, the long latency and transient times are believed to be due to the finite response rate of the solenoid valve.
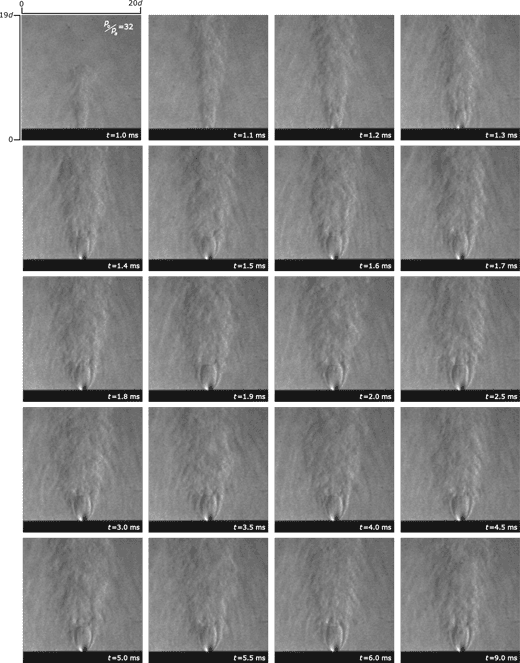
A set of time-delayed Schlieren imaging was also carried out to investigate the time evolution of the formation of the underexpanded jet in quiescent medium. An example of the pseudo time history is shown in the following figure.